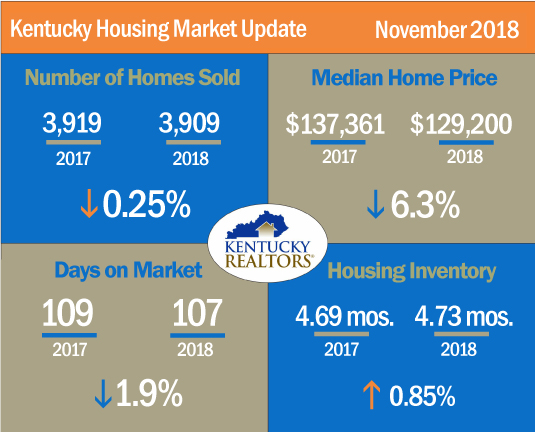
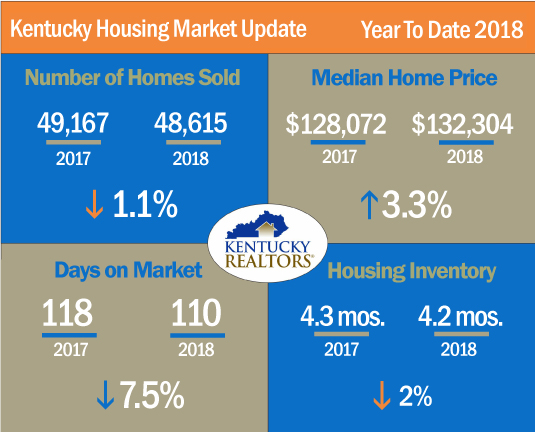
 Kentucky home sales in November are down just one-quarter of one percent from November 2017. Units sold topped out at 3,909 homes which is just 10 units shy of last years mark of 3,919. The 2018 housing market is almost as strong as last year’s record-breaking mark. 2018 numbers are down just 1.1% at 48,615 units sold compared to 2017’s tally of 49,167.
Nationwide, existing-home sales increased in November, according to the National Association of Realtors®, marking two consecutive months of increases. Unlike Kentucky, however, year-over-year numbers are down 7% from 2017. Lawrence Yun, NAR’s chief economist, says two consecutive months of increases is a welcomed sign for the market. “The market conditions in November were mixed, with good signs of stabilizing home sales compared to recent months, though down significantly from one year ago. Rising inventory is clearly taming home price appreciation.”
 Steve Cline, President of Kentucky REALTORS®, said that certain areas of the state have stronger than usual numbers and are causing the home sales tally to flirt with record territory. “While most area sales remain largely unchanged over last November, some areas are seeing record-breaking numbers of units being sold. Places like Greater Owensboro, Hardin County, the Bowling Green area, and particularly Ashland have seen their highest sales in over a decade. Ashland’s November numbers bested their high-water mark by an amazing 21%.”
The median home price fell by 6.3% in November after rising for three consecutive months, easing concerns that falling inventory might raise prices high enough to begin pricing some first-time home buyers out of the market. November 2018 numbers topped out at $129,200 while the 2017 level was $137,361.
While the November housing inventory was up slightly over last year at 4.73 months, the year-to-date inventory fell 2% to 4.2 months. Kentucky continues to have low inventory levels. Six months of inventory is considered to be a comfortable standard by most economists.
Days on market levels also dropped slightly in both year-over-year and year-to-date measurements. November saw houses on the market for an average of 107 days, down from 109 one year ago.
